Microscopia eletrônica de transmissão de alta resolução (HRTEM ou HREM) é o contraste de fase (o contraste de imagens de microscopia eletrônica de alta resolução é formado pela diferença de fase entre a onda projetada sintetizada e a onda difratada, é chamada de contraste de fase). Microscopia, que fornece um arranjo atômico da maioria dos materiais cristalinos.
High-resolution transmission electron microscopy began in the 1950s. In 1956, JWMenter directly observed parallel strips of 12 Å copper phthalocyanine with a resolution of 8 Å transmission electron microscope, and opened high-resolution electron microscopy. The door to surgery. In the early 1970s, in 1971, Iijima Chengman used a TEM with a resolution of 3.5 Å to capture the phase contrast image of Ti2Nb10O29, and directly observed the projection of the atomic group along the incident electron beam. At the same time, the research on high resolution image imaging theory and analysis technology has also made important progress. In the 1970s and 1980s, the electron microscope technology was continuously improved, and the resolution was greatly improved. Generally, the large TEM has been able to guarantee a crystal resolution of 1.44 Å and a dot resolution of 2 to 3 Å. HRTEM can not only observe the lattice fringe image reflecting the interplanar spacing, but also observe the structural image of the arrangement of atoms or groups in the reaction crystal structure. Recently, Professor David A. Muller’s team at Cornell University in the United States used laminated imaging technology and an independently developed electron microscope pixel array detector to achieve a spatial resolution of 0.39 Å under low electron beam energy imaging conditions.
Atualmente, os microscópios eletrônicos de transmissão geralmente são capazes de realizar HRTEM. Esses microscópios eletrônicos de transmissão são classificados em dois tipos: alta resolução e analítico. O TEM de alta resolução é equipado com uma peça de pólo objetivo de alta resolução e uma combinação de diafragma, o que torna o ângulo de inclinação da mesa de amostra pequeno, resultando em um menor coeficiente de aberração esférica objetivo; enquanto o TEM analítico requer uma quantidade maior para várias análises. O ângulo de inclinação do estágio de amostra, de modo que o suporte da haste da lente objetiva é usado de maneira diferente do tipo de alta resolução, afetando a resolução. Em geral, um TEM de alta resolução de 200 kev tem uma resolução de 1,9 Å, enquanto um TEM analítico de 200 kev tem um 2,3 Å. Mas isso não afeta a TEM analítica que captura a imagem de alta resolução.
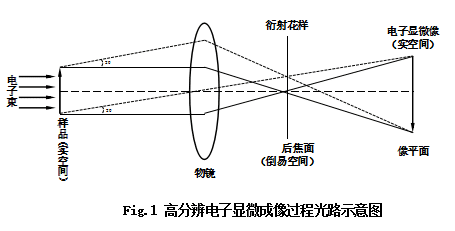
As shown in Fig. 1, the optical path diagram of the high-resolution electron microscopy imaging process, when an electron beam with a certain wavelength (λ) is incident on a crystal with a crystal plane spacing d, the Bragg condition (2dsin θ = λ) is satisfied, A diffracted wave is generated at an angle (2θ). This diffracted wave converges on the back focal plane of the objective lens to form a diffraction spot (in an electron microscope, a regular diffraction spot formed on the back focal plane is projected onto the phosphor screen, which is a so-called electron diffraction pattern). When the diffracted wave on the back focal plane continues to move forward, the diffracted wave is synthesized, an enlarged image (electron microscopic image) is formed on the image plane, and two or more large objective lens stops can be inserted on the back focal plane. Wave interference imaging, called high-resolution electron microscopy, is called a high-resolution electron microscopic image (high-resolution microscopic image).
Como mencionado acima, a imagem microscópica eletrônica de alta resolução é uma imagem microscópica de contraste de fase formada pela passagem do feixe transmitido do plano focal da lente objetiva e dos vários feixes difratados através da pupila objetiva, devido à sua coerência de fase. Devido à diferença no número de feixes difratados participantes da geração de imagens, são obtidas imagens de alta resolução de nomes diferentes. Devido às diferentes condições de difração e espessura da amostra, as micrografias eletrônicas de alta resolução com diferentes informações estruturais podem ser divididas em cinco categorias: franjas de treliça, imagens estruturais unidimensionais, imagens de treliça bidimensional (imagens de célula única), bidimensionais imagem da estrutura (imagem em escala atômica: imagem da estrutura cristalina), imagem especial.
Franjas de treliça: Se um feixe de transmissão no plano focal traseiro for selecionado pela lente objetiva e um feixe de difração interferir entre si, é obtido um padrão de franja unidimensional com uma mudança periódica de intensidade (como mostrado pelo triângulo preto em Fig. 2 (f)) Essa é a diferença entre uma franja de rede e uma imagem de rede e uma imagem estrutural, que não exige que o feixe de elétrons seja exatamente paralelo ao plano da rede. Na verdade, na observação de cristalitos, precipitados e similares, as franjas de treliça são frequentemente obtidas por interferência entre uma onda de projeção e uma onda de difração. Se um padrão de difração de elétrons de uma substância como cristalitos for fotografado, um anel de adoração aparecerá como mostrado na (a) da Fig. 2.
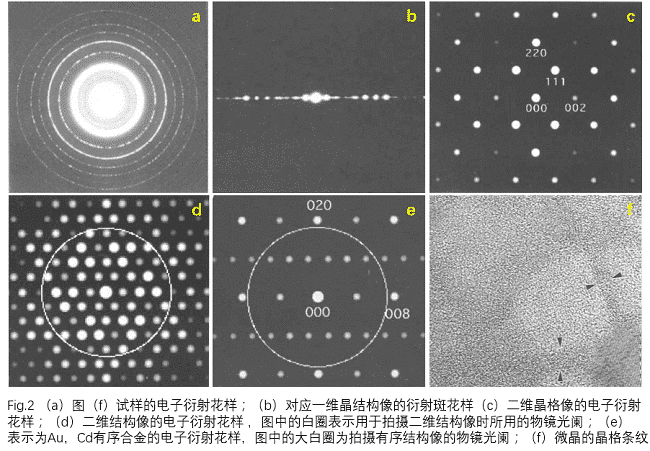
Imagem da estrutura unidimensional: se a amostra tiver uma certa inclinação, de modo que o feixe de elétrons seja paralelo a um determinado plano de cristal do cristal, ele pode satisfazer o padrão de difração de difração unidimensional mostrado na Fig. 2 (b) ( distribuição simétrica em relação ao ponto de transmissão) Padrão de difração). Nesse padrão de difração, a imagem de alta resolução obtida sob a condição de foco ideal é diferente da franja da rede e a imagem da estrutura unidimensional contém as informações da estrutura do cristal, ou seja, a imagem da estrutura unidimensional obtida, como mostrado na Fig. 3 (uma imagem estrutural unidimensional de alta resolução do óxido supercondutor de base bi-mostrada.
Two-dimensional lattice image: If the electron beam is incident parallel to a certain crystal axis, a two-dimensional diffraction pattern can be obtained (two-dimensional symmetric distribution with respect to the central transmission spot, shown in Fig. 2(c)). For such an electron diffraction pattern. In the vicinity of the transmission spot, a diffraction wave reflecting the crystal unit cell appears. In the two-dimensional image generated by the interference between the diffracted wave and the transmitted wave, a two-dimensional lattice image showing the unit cell can be observed, and this image contains information on the unit cell scale. However, information that does not contain an atomic scale (into atomic arrangement), that is, a two-dimensional lattice image is a two-dimensional lattice image of single crystal silicon as shown in Fig. 3(d).
Two-dimensional structure image: a diffraction pattern as shown in Fig. 2(d) is obtained. When a high-resolution electron microscope image is observed with such a diffraction pattern, the more diffraction waves involved in imaging, the information contained in the high-resolution image is also The more. A high-resolution two-dimensional structure image of the Tl2Ba2CuO6 superconducting oxide is shown in Fig. 3(e). However, the diffraction of the high-wavelength side with higher resolution limit of the electron microscope is unlikely to participate in the imaging of the correct structure information, and becomes the background. Therefore, within the range allowed by the resolution. By imaging with as many diffracted waves as possible, it is possible to obtain an image containing the correct information of the arrangement of atoms within the unit cell. The structure image can only be observed in a thin region excited by the proportional relationship between the wave participating in imaging and the thickness of the sample.
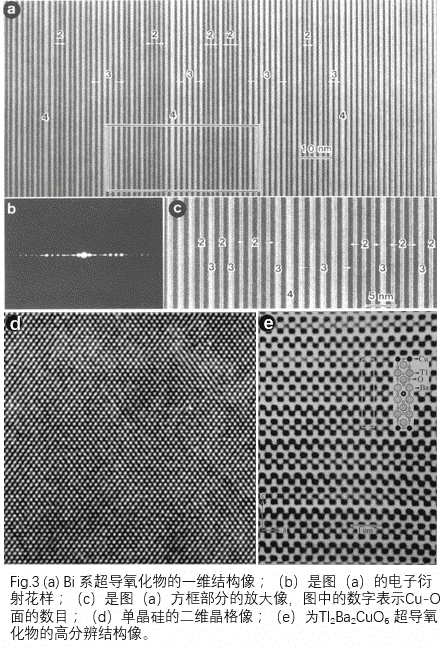
Imagem especial: No padrão de difração do plano focal traseiro, a inserção da abertura seleciona apenas a imagem de onda específica para poder observar a imagem do contraste da informação estrutural específica. Um exemplo típico disso é uma estrutura ordenada como. O padrão de difração de elétrons correspondente é mostrado na Fig. 2 (e) como o padrão de difração de elétrons da liga ordenada por Au, Cd. A estrutura ordenada é baseada em uma estrutura cúbica centrada na face na qual os átomos de Cd são organizados em ordem. Fig. 2 (e) os padrões de difração de elétrons são fracos, exceto pelas reflexões básicas da rede dos índices (020) e (008). Reflexão ordenada da estrutura, usando a lente objetiva para extrair a reflexão básica da estrutura, usando ondas de transmissão e imagens ordenadas da reflexão da estrutura, apenas átomos de Cd com pontos brilhantes ou pontos escuros, como alta resolução, como mostrado na Fig. 4.
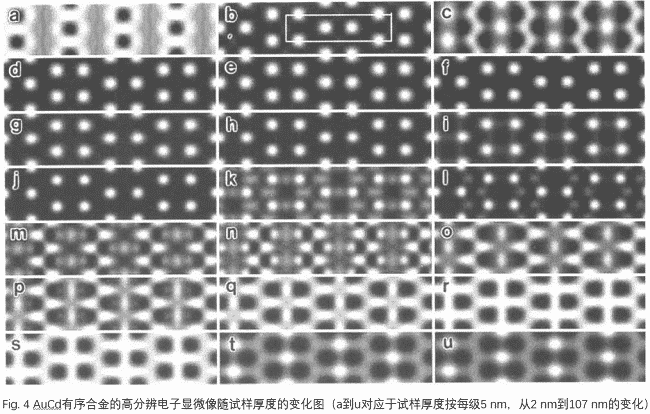
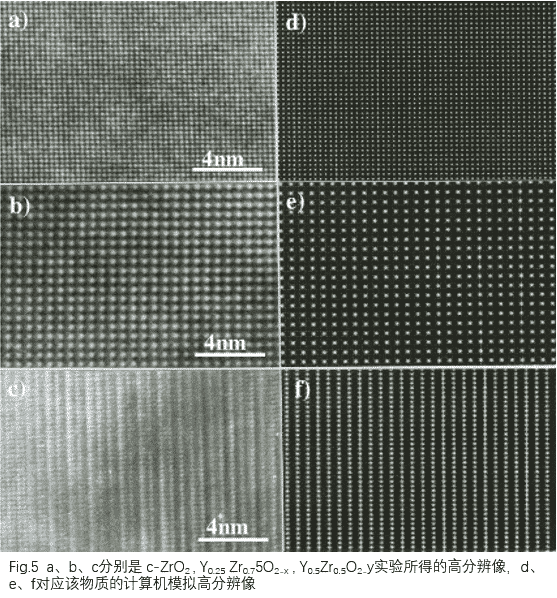
As shown in Fig. 4, the high resolution image shown varies with the thickness of the sample near the optimum high resolution underfocus. Therefore, when we get a high-resolution image, we can’t simply say what the high-resolution image is. We must first do a computer simulation to calculate the structure of the material under different thicknesses. A high resolution image of the substance. A series of high-resolution images calculated by the computer are compared with the high-resolution images obtained by the experiment to determine the high-resolution images obtained by the experiment. The computer simulation image shown in Fig. 5 is compared with the high resolution image obtained by the experiment.
