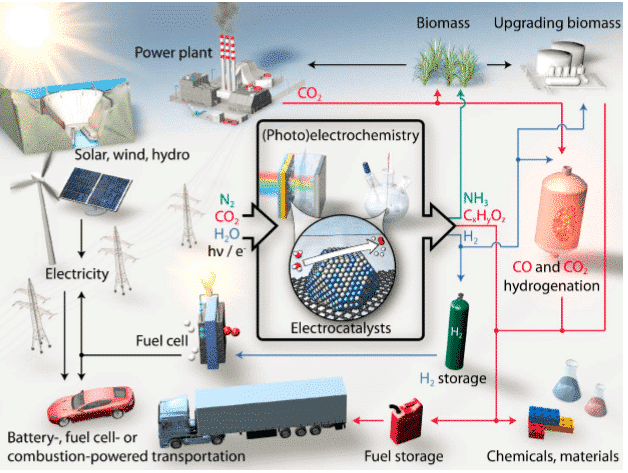
Electrocatalytic reaction technology is one of the key methods driving these energy conversion and environmental purification pathways.
In recent years, with the development of society and the progress of mankind, increasingly serious energy and environmental problems have become a worldwide problem that needs to be solved urgently. People are committed to the effective use of new energy sources and long-term purification methods of the environment. The current effective research methods to promote energy conversion and environmental purification involve many directions, such as fuel cell development, hydrogen production, CO2 resource, organic Catalytic conversion of exhaust gas. The electrochemical test methods as a theoretical guide provides a rational means of interpretation for the development of electrocatalyst performance. This paper summarizes the electrochemical test methods commonly used in several electrochemical reactions.
Figure 1 Sustainable energy conversion electrocatalytic process
1.cyclic voltammetry
Cyclic Voltammetry (CV) is the most commonly used research method for evaluating unknown electrochemical systems. It is mainly obtained by controlling the electrode potential at different rates and scanning one or more times with a triangular waveform over time. Current-potential curve (iE). Different reduction and oxidation reactions can occur alternately on the electrodes in different potential ranges. The reversibility of the electrode reaction can be judged according to the shape of the curve; the adsorption and desorption peaks of the reactants can be used to evaluate the electrocatalyst according to the specific potential range. The catalytically active area can also be used to obtain useful information on complex electrode reactions.
Figure 1.1 Scanning current potential response curve
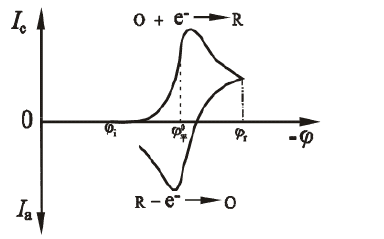
As shown in Fig. 1.1, the potential of the first half is scanned toward the cathode, and the electroactive substance is reduced on the electrode to generate a reduction wave. When the potential of the latter half is scanned toward the anode, the reduction product is again oxidized on the electrode to generate an oxidation wave. Two useful parameters of the cyclic voltammetry i-E curve are the peak current ratio ipa/ipc and the peak potential difference Epa-Epc. For the Nernst wave of the stable product, the peak current ratio ipa/ipc = 1, independent of the scanning speed, diffusion coefficient, and commutation potential. When the cathode scan is stopped, the current is degraded to 0 and then reverse scand. The obtained i-E curve is exactly the same as the cathode curve, but is drawn in the opposite direction of the I coordinate and the E coordinate. The ratio ipa/ipc deviates from 1, indicating that the electrode process is not a fully reversible reaction process involving homogeneous kinetics or other complications. The reaction peak height and peak area can be used to estimate system parameters such as the concentration of electroactive species or the velocity constant of the coupled homogeneous reaction. However, the CV curve is not an ideal quantitative method, and its powerful use is more in its qualitative semi-quantitative Judging ability.
2.pulse voltammetry
Pulse voltammetry is an electrochemical measurement method based on the behavior of polarographic electrodes. It is used to study the redox process in various media, the adsorption of surface materials on catalyst materials and the electron transfer mechanism on the surface of chemically modified electrodes. Detection is especially effective. Pulse voltammetry includes step voltammetry, conventional pulse voltammetry, differential pulse voltammetry, and square wave voltammetry depending on the way the voltage is scanned. Among them, the step voltammetry is similar to the potential sweep method, and the response of most systems to the higher resolution (ΔE < 5 mV) step volt-ampere is very similar to the linear scan experiment results of the same scan speed.
3. electrochemical impedance spectroscopy
Electrochemical impedance spectroscopy is to apply a perturbed electrical signal to the electrochemical system. Unlike the linear scanning method, the electrochemical system is far away from the equilibrium state, and then the response of the system is observed, and the electrochemical properties of the system are analyzed by the response electrical signal. Electrochemical impedance spectroscopy is often used to analyze, evaluate the ORR reaction in PEM fuel cells, characterize the diffusion loss on the surface of the catalyst material, estimate the ohmic resistance, and the characteristics of charge transfer impedance and double layer capacitance to evaluate and optimize the membrane electrode assembly.
The impedance spectrum is usually drawn in the form of a Bode diagram and a Nyquist diagram. In the Bode diagram, the magnitude and phase of the impedance are plotted as a function of frequency; in the Nyquist diagram, the imaginary part of the impedance is plotted at each frequency point relative to the real part. The high frequency arc reflects the combination of the double layer capacitance of the catalyst layer, the effective charge transfer impedance, and the ohmic resistance, which reflects the impedance produced by mass transfer. For a given system, the two regions are sometimes not well defined.
Figure 3.1 Impedance spectrum of electrochemical system
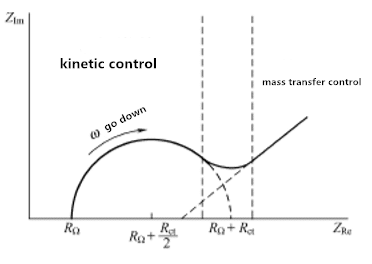
Figure 3.1 shows the extreme characteristics of kinetic control and mass transfer control. However, for any given system, the two regions are probably not well defined. The determining factor is the relationship between the charge transfer resistance and the transmission impedance. If the chemical system is slow in kinetics, it will show a large Rct, which appears to have a very limited frequency region. When the system is dynamic, Material transfer always plays a leading role, and semi-circular areas are difficult to define.
4. chronoamperometry
The chronoamperometry method is a transient control method that can be used to evaluate the adsorption and diffusion of the catalyst surface. The chronoamperometry curve is obtained by applying a potential step to the electrochemical system to measure the change of the current response signal over time. When a potential step is given, the basic waveform is shown in Figure 4.1(a), and the surface of the solid electrode is analyzed with an electroactive material. After the potential step is applied, the electroactive species near the surface of the electrode are first reduced to a stable anion radical, which requires a large current since the process occurs immediately at the step instant. The current flowing thereafter is used to maintain the conditions under which the electrode surface active material is completely reduced. The initial reduction causes a concentration gradient (ie, concentration) between the electrode surface and the bulk solution, and the active material thus begins to continuously diffuse toward the surface and diffuse to the electrode. The active material on the surface is completely reduced immediately. The diffusion flow, that is, the current, is proportional to the concentration gradient of the electrode surface. However, it is noted that as the reaction proceeds, the active material in the bulk solution diffuses continuously toward the surface of the electrode, causing the concentration gradient region to gradually extend toward the bulk solution, and the surface concentration gradient of the solid electrode gradually becomes smaller (depleted), and the current gradually changes. small. The concentration distribution and current versus time are shown in Figure 4.1(b) and Figure 4.1(c).
Figure 4.1 (a) Step experimental waveform, reactant O does not react at potential E1, is reduced at E2 at diffusion limit speed; (b) concentration distribution at different times; (c) current versus time curve

5.rotating disk electrode technology
Rotating disk electrode (RDE) technology is very useful in studying the coupled homogeneous reaction of catalyst surface, so that the electrochemical reaction on the surface of the catalyst is carried out under a relatively steady state condition. RDE can control substances with slower diffusion, such as gas easily diffusing into the solution, reducing the influence of the diffusion layer on the current density distribution. Thus, a stable current density is obtained, which is in an approximate steady state, which is beneficial to the process of electrochemical analysis; RDE can control the speed at which the electrolyte reaches the electrode surface by adjusting the rotational speed, and measure the parameters of the electrocatalytic reaction process at different rotational speeds. analysis.
As humans become more interested in developing advanced electrocatalysts for clean energy conversion, in addition to emphasizing the use of some basic methods for the characterization of electrocatalytic reactions, further examination of the elementary steps of each reaction is needed to determine the involved The combination of key intermediates, the surface of the intermediate, and the energy of each elementary reaction step. The study of electrochemical methods still requires many details on the electrode-electrolyte interface that has not been known so far, such as the kinetics and reaction barriers involved in key elementary steps of proton/electron transfer; near solvents, cations and reaction interfaces. The atomic, molecular-level state description of the anion; and the faster and more efficient real-time signal acquisition methods throughout the electrochemical reaction process are still at the forefront of electrocatalytic reactions. In summary, in-depth study of electrochemical characterization methods provides a guiding strategy for the development of new high-efficiency catalyst systems.
